How to Calculate Mean Absolute Deviation (MAD)
- Math Lessons >
- Mean Absolute Deviation
Overview of Mean Absolute Deviation:
In this lesson, we’ll focus on the mean absolute deviation (MAD), a measure of spread or dispersion in statistics.
Why Is Mean Absolute Deviation Important?
Let’s understand the importance of mean absolute deviation with this scenario.
A store that sells warm winter clothes records an average monthly sale of $50,000. The sale is high during the winter, and there’s nothing much happening when it’s not wintry.
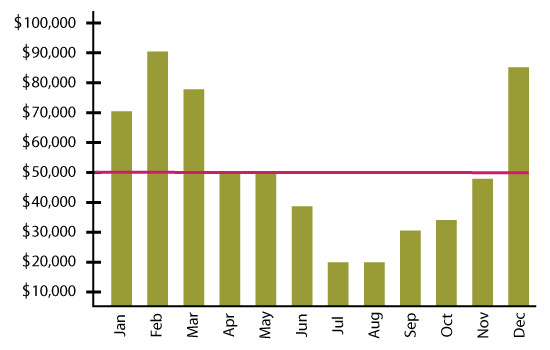
The mean or average, in this case, will be a misinterpretation of the actual data. We need to look for a value that will tell us more about the spread or variability of a data set. This is when mean absolute deviation comes into the picture.
Calculating Mean Absolute Deviation
Let's take a plunge and understand variability with this scenario.
Ralph and Sandra practice basketball after school every day. The tables below show the duration of their practice sessions for the last five days.

Let’s first find the average of Ralph’s and Sandra’s practice sessions.
Ralph’s Mean Time = 10 + 15 + 30 + 50 + 455
= 1505
= 30
Sandra’s Mean Time = 35 + 25 + 30 + 30 + 305
= 1505
= 30
The mean is 30 minutes in both cases.
Now when you look at the table, you will notice that Sandra’s practice time was pretty much the same each day. Ralph’s, on the other hand, ranged from very short on some days to very long on other days. Let’s visualize this with a dot plot.
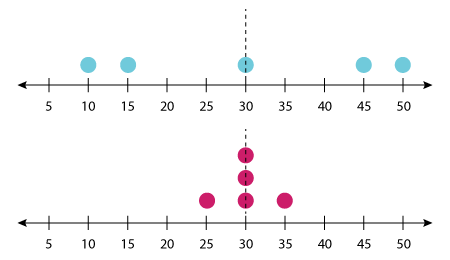
As you can see, Sandra's practice sessions have clustered around the mean while Ralph's have spread out. Therefore, the mean will be a misrepresentation of Ralph’s actual practice sessions.
We need to find the degree to which the data tends to spread around the average value. This is called the dispersion or variability of the data set.
Let’s focus on Ralph’s practice sessions and figure out how much each data point has deviated from the mean. We'll subtract each data point from the mean to figure out the deviation of Ralph’s session.
We are interested in how far each data point is from the mean, so we need not worry about the deviations being on the left or right. So as distance cannot be negative, we’ll take absolute values of the deviations.
Finally, our mean absolute deviation is:
20 + 15 + 0 + 20 +155
⇨ MAD = 14
Therefore, the mean absolute deviation of Ralph’s sessions is 14 minutes.
Let's move on to Sandra's table of values – 35, 25, 30, 30, and 30 minutes. But, this time we’ll adopt a standard method to find the MAD.
Calculating Mean Absolute Deviation Using Formula
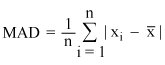
A formal way of finding the mean absolute deviation is by using the formula. The formula is:
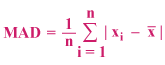
where Σ means sum up to, the vertical bars denote the absolute value, xi is each data point, x̅ is the mean or average, and n is the number of values.
Let’s plug Sandra’s session timings in the formula.
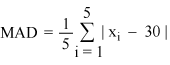
= |x1 – 30| + |x2 –30| +|x3 –30| + |x4 –30| + |x5 –30|5
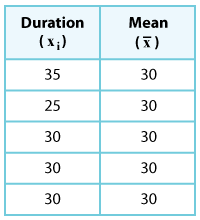
= |35 – 30| + |25 – 30| + |30 – 30| + |30 – 30| + |30 – 30|5
= |5| + |–5| + |0| + |0| + |0|5
= 5 + 5 + 0 + 0 + 05
= 105
⇨ MAD = 2
Thus, the mean absolute deviation of Sandra’s sessions is 2 minutes.
Comparing the two mean absolute deviations, it is pretty clear that there is more variability in Ralph’s practice sessions than there is in Sandra’s sessions. Sandra has been pretty much consistent with her practice sessions while Ralph's have been inconsistent.
The mean absolute deviation or MAD gives us a clear picture of this diversity.
Make MAD Calculations Simpler Using Mean Calculator!
Type any number of data values separated by commas, and calculate the mean in no time!
It’s Your Turn Now!
1) Calculate the mean absolute deviation of this data set.
8, 16, 18, 23, 24, 25
(xi)
(x̅)
(xi – x̅)
(|xi – x̅|)
MAD = 11 + 3 + 1 + 4 + 5 + 66
= 306
⇨MAD = 5
The mean absolute deviation of the given data set is 5.
2) The sprint speed (in mph) of 8 athletes are as follows:
10, 11, 13, 14, 15, 16, 16, 17
The mean of the above data set is:
10 + 11 + 13 + 14 + 15 + 16 + 16 + 178
x̅ = 14
=|14 - 10| + |14 - 11| + |14 - 13| + |14 - 14| + |14 - 15| + |14 - 16| + |14 - 16| + |14 - 17|8
=4 + 3 + 1 + 0 + 1 + 2 + 2 + 38
⇨MAD = 2
The mean absolute deviation the given data set is 2 miles per hour.
Summing Up!
The mean absolute deviation is a measure of dispersion or variation in a set of numerical data.
It is the average distance between each data point of a data set and the mean.
As MAD measures the spread of a data set, it indicates if the mean is the correct representation or misrepresentation of each data in the set.
To calculate the MAD of a set of data, add the distances between each data value and the mean and then divide by the number of data values.

Buff up on calculating MAD with our free printable Mean Absolute Deviation worksheets!